In January, when cases of COVID 19 appeared to be increasing exponentially in Wuhan, financial markets around the globe began to react. After initially declining, stocks briefly rallied before beginning one of the most rapid and ferocious declines in history.
Is this like a Storm that will Peak and Pass?
We all find ourselves in a bizarre new world, with little ability to grasp the potential impact on our social and economic lives. There is a desire to assume that the crisis will peak and our lives will quickly return to normal. Our perspectives are shaped by our experiences. Even the worst storms reach peak intensity and then subside and, in the next day or so, the sun is shining and the weather returns to normal. The economic allegory of the storm that passes is that, after a month or two, people will return to work, and life will return to normal. This experiential learning is NOT an effective way to make sense of the potential impact of COVID-19.
Much effort has been expended trying to persuade the public to “flatten the curve.” That refers to lowering the incidence of infections so that hospitals won’t be overwhelmed with patients requiring critical care without the capacity to help. That’s clearly desirable. However, it’s worth pointing out that flattening the curve means extending the time that it takes for infections to spread through a population.
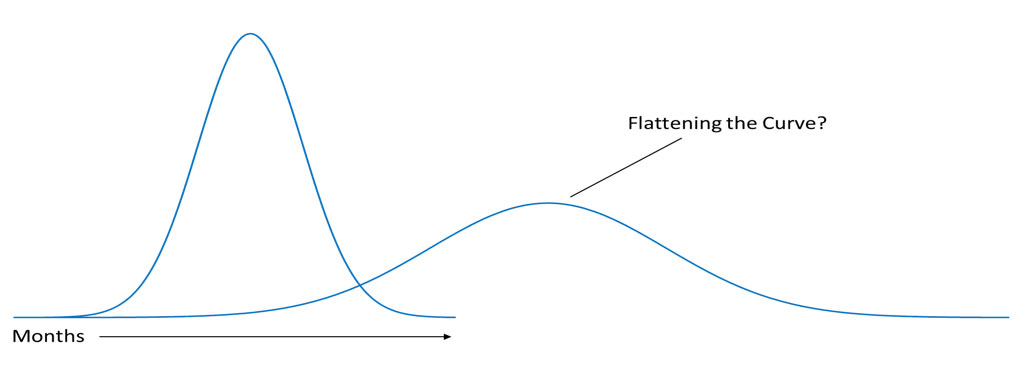
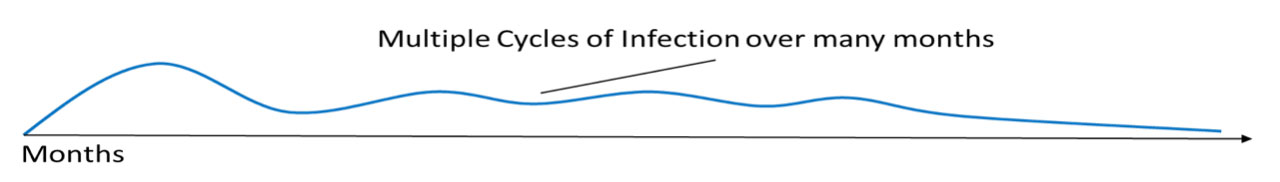
We may be framing this situation with the wrong graphic, however. There may be multiple periods of infection over the next 12 to 18 months as occurred during the Spanish Flu global pandemic.
As governments experiment with trying to restart their economies, they will be confronted with the relentless and brutal tradeoff between economic activity and saving lives. Going back to work for most people in the short term seems improbable. Just a few months ago, there was just one person on the planet with the disease that now has infected nearly 1,900,000 people in virtually every country. Even if a community has very few infected people, that could be enough to restart a second or third upward progression of the incidence of COVID-19. And presently, the only effective way that governments have been able to reduce the spread is through social distancing, which is primarily responsible for lowering infections.
Also circulating in the press is the notion of restoring economic activity through having immune people go back to work while older and vulnerable people remain in a state of extreme Netflix. This could prevent additional infections and help avoid the tradeoff between lives and money. The idea is bereft of math, however. Even with the awesome number of around 1,900,000 infected globally so far, that’s only .024% of the population of the planet. That means that only 24 out of every 100,000 citizens globally would possibly have immunity and could safely head back to the office.
Zoom Out
This is likely not a storm that will pass with a speedy return to normality. Our view is that absent a medical solution, some state of limited mobility and economic activity will persevere. The problem with this scenario is that financial assets were highly priced as we entered this decline. Instead of growing at a projected 2% rate in 20201, our economy may contract significantly, with unemployment potentially reaching levels not seen since the Great Depression. Two things are happening. Earnings are decreasing, and the amount that we pay for earnings is decreasing, increasing the ferocity of declines. The market may struggle to recover for some time. This means that the prospect for financial assets is that they will remain subdued or declining for months and potentially longer than a year.
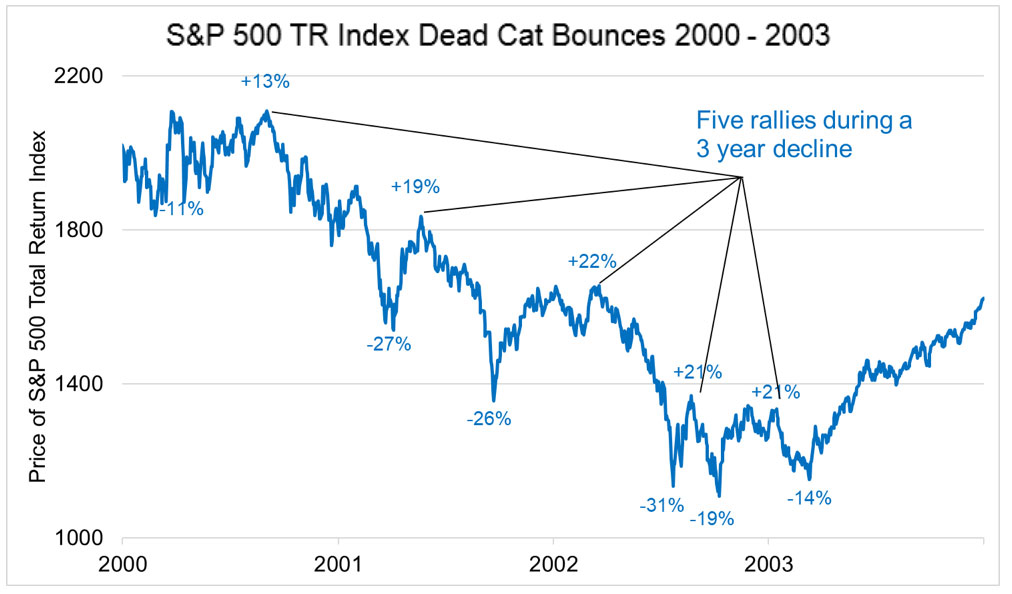
Within long term declines there are often strong rallies that lead investors to believe that markets have bottomed. During the three-year decline from 2000-2002, stocks rallied 5 times, only to reverse each time and eventually realized losses of nearly 50%. We may have seen one such move over the past few weeks. This could be a bottom, but it could just as likely be a short term bounce that will be followed by further declines. By zooming out and assuming that losses may continue for some time, we can attempt to prepare for the worst, but hope for the best.
We’re Here to Attempt to Help You Manage Risk
Our investors have many issues related to the Coronavirus Crisis, including their health, their jobs, their incomes, and the viability of their businesses. During times when economies are vulnerable, it’s important to have diversifiers–parts of your portfolio that attempt to uncorrelate from economic activity and to become defensive when everything else is deteriorating.
It’s vital to note, then, that Toews strategies were conceived with the objective of attempting to help navigate extreme and unexpected markets.
During the 2008 Financial Crisis, a number of our strategies were on the sidelines as markets deteriorated but were able to re-enter financial assets at reduced prices and participate in the rally that occurred in 2009. We see a similar possibility following this decline. Over the coming year, it is highly likely that news at times will cause investors anxiety. Remember, however, that at Toews, we have a plan in place to attempt to address falling markets.
Toews Operations during the Coronavirus Crisis
The outbreak of coronavirus (COVID-19) is continuing to impact people and countries around the world. Right now, our number one priority at Toews is the physical and financial health and safety of our clients and associates. We’ve taken steps to try to ensure that we can continue to serve our clients as effectively as possible, while also protecting our employees and their families.
At Toews, we regularly test our disaster recovery plans, including our pandemic plan, in order to prepare for unexpected events. In accordance with our pandemic plan procedures, we have shifted our business practices, and employees are working from remote locations using secure technology. We have also taken steps to determine whether our partners are able to operate remotely as well. Our employees are available by phone and email and are able to answer any questions or concerns that you may have during this time.
Disclosure
Prior performance is no guarantee of future results. There can be no assurance, and individuals should not assume, that future performance of any of the portfolios referenced will be comparable to past performance. There can be no assurance that Toews will achieve its performance objectives.
This commentary may include forward-looking statements. All statements other than statements of historical fact are forward-looking statements (including words such as “believe,” “estimate,” “anticipate,” “may,” “will,” “should,” and “expect”). Although we believe that the expectations reflected in such forward-looking statements are reasonable, we can give no assurance that such expectations will prove to be correct. Various factors could cause actual results or performance to differ materially from those discussed in such forward-looking statements.
This commentary is intended to provide general information only and should not be construed as an offer of specifically-tailored individualized advice. Please contact your investment adviser, accountant, and/or attorney for advice appropriate to your specific situation.
The S&P 500 Index (S&P) is one of the world’s most recognized indexes by investors and the investment industry for the equity market. The S&P, however, is not a managed portfolio and is not subject to advisory fees or trading costs. Investors cannot invest directly in the S&P 500 Index. The S&P returns also reflect the reinvestment of dividends. Clients or prospective clients should be aware that the referenced benchmark funds may have a different composition, volatility, risk, investment philosophy, holding times, and/or other investment-related factors that may affect the benchmark funds’ ultimate performance results. Therefore, an investor’s individual results may vary significantly from the benchmark’s performance.
The ICE Bank of America Merrill Lynch US Cash Pay High Yield Index has been used as a comparative benchmark because the goal of the above account is to provide bond-like returns. The index is generally used to measure market performance of fixed-rate, coupon-bearing bonds with an outstanding par of greater than or equal to $50 million, a maturity range greater than or equal to one year and must be less than BBB/Baa3 rated but not in default.
The MSCI EAFE Index is an index created by Morgan Stanley Capital International (MSCI) that serves as a benchmark of the performance of large and mid-cap securities in developed markets in Europe, Australia and Southeast Asia, excluding the U.S. and Canada.
Investors cannot invest directly in an index.
For additional information about Toews, including fees and services, send for our disclosure statement as set forth on Form ADV by contacting Toews at Toews Corporation, 1750 Zion Road, Suite 201, Northfield, NJ 08225-1844 or (877) 863-9726. 1779014/063020 MK
An investor should consider the Fund’s investment objectives, risks, charges, and expenses carefully before investing. This and other information about the Funds is contained in the Fund’s prospectus, which can be obtained by calling 877-558-6397. Please read the prospectus carefully before investing. Toews Funds are distributed by Northern Lights Distributors, LLC, FINRA/SIPC. Toews Corporation is not affiliated with Northern Lights Distributors, LLC. 2147-NLD-4/15/2020
1Source of Data: https://fred.stlouisfed.org/series/GDPC1CTM; Accessed 4/13/2020
2The return of -11% represents the period from 12/31/1999 to 4/14/2000. The return of 13% represents the period from 4/14/2000 to 9/1/2000. The return of -27% represents the period from 9/1/2000 to 4/4/2001. The return of 19% represents the period from 4/4/2001 to 5/21/2001. The return of -26% represents the period from 5/21/2001 to 9/21/2001. The return of 22% represents the period 9/21/2001 to 3/19/2002. The return of -31% represents the period from 3/19/2002 to 7/23/2002. The return of 21% represents the period from 7/23/2002 to 8/22/2002. The return of -19% represents the period from 8/22/2002 to 10/9/2002. The return of -14% represents the period from 10/9/2002 to 3/11/2003.